In 2015 I scraped the City of Seattle business permitting database for new restuarant permits issed by week. I made an interactive map using D3 which is live at Seattle Restaurant Changes. I summarized all my findings in this blog post
Close Project
I was interested in when the best and worst episode of a TV show occured during the entirety of a TV series. I used OMDb API and built a site running at bingetrendy
Close Project
I was interested in visiting every park in Seattle and I used Leaflet to create a clickable map that stored results in LocalStorage of the client's browser. This project is live at Seattle Parks Complete with the full code available on GitHub.
Close Project
Has the creation of the Pac 12 Network affected attendance for UW home football games? I scraped the data from Wikipedia and wrote up my findings in this blog post
Close Project
The now defunct Seattle bikeshare Pronto had an Open Data visualization competition. This is my entry which is live at Pronto Stories and available on GitHub
Close Project
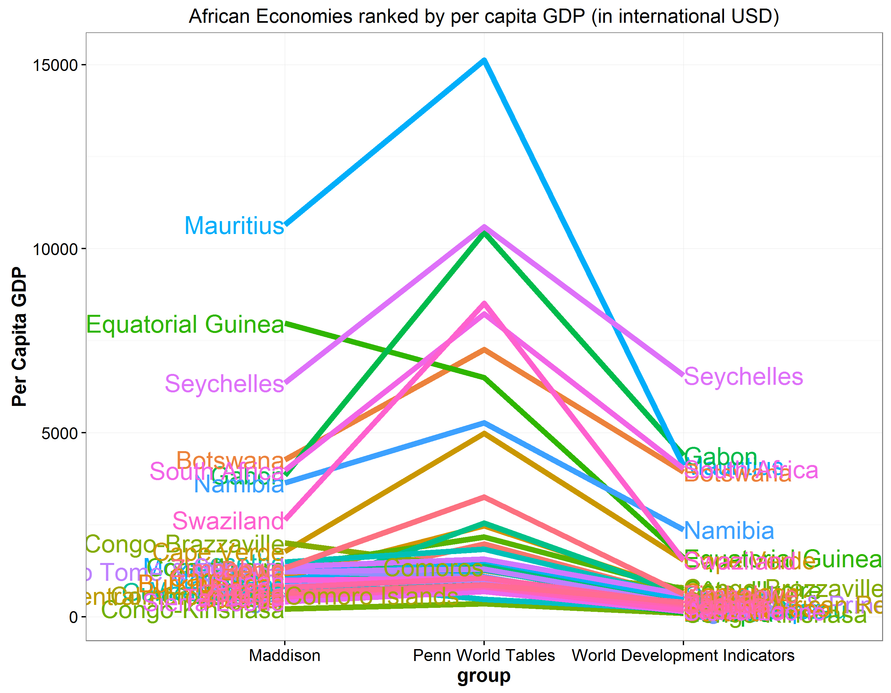
I read the book Poor Numbers by Morton Jerven and wanted to replicate the slopeplots from the book but instead by using ggplot2 with R. Full description of the project at this blog post
Close Project
Mapping NPS visit data over time for the National Parks using D3. Fully summarized in this blog post
Close Project
I was curious how many episodes of This American Life I had listened to by year so I scraped all the episodes marked as listened to in my account and plotted the results with D3. Full description of the project at this blog post
Close Project
The Listserve is an email listserve open to anyone currently with around 20,000 subscribers. I took every email sent the first year and did a brief textual analysis on the text of the email and made some basic dendrograms. Full description of the project at this blog post
Close Project